

By Nick Finnis
3rd December 2023Long range Winter forecast 2023/2024
At a glance
- Overall for the 3 winter months, temperatures are forecast to be close to the 1991-2020 long-term average. December close to the average, January equal chance of being average or above average and February below average.
- Average or above average rainfall is expected across the season – greatest probability is for December and January above average, though February could see below average.
- December will be generally mild and unsettled after a cold start but may end on a cold note from around Christmas. January’s general theme for the month is alternating mild spells and perhaps a few cold snaps. Low confidence that a Sudden Stratospheric Warming may occur that could bring a cold end to the month lingering into February. February looks to be the coldest winter month, with greatest chance of a more prolonged cold and drier spell, but milder spells likely too.


Winter Forecast Month By Month
December
A cold first 4-5 days to the month, with a blocking high over the far North Atlantic and Greenland and upper low over eastern Europe pulling cold Polar continental air across the UK. However, as the block collapses by the 4th, Atlantic lows will move in from the west, bringing milder and unsettled conditions to the south at least, though northern areas, especially Scotland, may hang on to colder conditions for the rest of the week commencing the 4th. There is a signal for a particularly strong jet stream to move across the Atlantic and in across western Europe from around the 6th- which could persist past mid-month, bringing a succession of low pressure systems east across western Europe, bringing wet and windy weather at times.
It will be predominantly mild across the south for a week or two, perhaps to at least around the 20th. However, with a signal for strong high pressure over Scandinavia and NW Russia and an increasingly southerly tracking jet, colder air may flirt with the north at times, bringing a risk of wintry weather here, lower risk the cold air may get further south too. There could be one or two deep depressions, named storms, during this period, bringing gales or severe gales. Later in the month, the UK may see more settled conditions develop – with high pressure building northeast across the UK, bringing an end Atlantic lows affecting the weather. High pressure perhaps settling over Scandinavia to form a blocking high. This could bring cold conditions around the Christmas to New Year period, with a chance of wintry weather in places, but low confidence. The signal for more settled and blocked conditions later in the month due to forecasts for the MJO to move into the western Pacific around mid-month – which tends to favour high latitude blocking after around a 10 day lag. Milder and more unsettled conditions may return by the end of the Year.
Probability for temperatures against 1991-2020 average: 40% chance close to average, 30% chance of above or 30% below average.
Probabilities for rainfall: 40% of chance for average, 40% chance of above average, 20% chance of below average.
January
Much of the month could be low pressure-dominated, lows tending to move east or northeast across northern Britain initially, but the mean upper low steering them may shift from the northwest to the northeast of the UK with time, which may allow pressure to build to the west at times, opening the door for occasional northwesterly or northerly flows. So we could see mild spells with wet and windy weather but also brief cold spells – including some snow for the north at times, low confidence of wintry weather in the south. Perhaps a small chance of temporary highs to the north, as the jet stream shifts further south, allowing a brief northeasterly or easterly flow later in the month, which could bring wintry threats to the south too.
There is an enhanced chance of a Sudden Stratospheric Warming during the month, due to extended forecasts indicating a weakening of the stratospheric polar winds and signs of favourable upper flow patterns during December for wave propagation towards the pole creating warming of the stratosphere. If an SSW occurs, it could bring blocked and more persistent cold weather after a few weeks of the SSW occurring, but if one occurs it’s no guarantee of colder weather. As such, confidence is low of one occurring and even lower of colder/blocked outcome. General theme for the month is alternating mild spells and shorter cold spells.
Probability for temperatures against 1991-2020 average: 40% chance above average, 40% chance of average or 20% below average.
Probabilities for rainfall: 50% of chance for above average, 30% chance of average, 20% chance of below average.
February
We think the last month of winter has the greatest chance of being the coldest month of winter. El Nino will likely have coupled with the atmosphere early in the New Year and historically this favours a greater risk of colder weather in February and March. Also, there is potential that an SSW favoured to occur in January could also bring high latitude blocking into the month. Even if a SSW doesn’t occur in January or February, analog composites of El Nino and eQBO winters along with current NWP seasonal forecast consensus suggests a greater chance of high latitude blocking or blocking over the UK. So, although some milder and unsettled weather appears likely, there could be prolonged spells of drier weather as high pressure becomes dominant. It could turn cold at times with the more blocked weather too, though confidence is low on how cold and where may be coldest and see risk of wintry weather. Increased chance that February will be drier than average.
Probability for temperatures against 1991-2020 average: 40% chance below average, 30% chance of average or 30% above average.
Probabilities for rainfall: 40% of chance for below average, 30% chance of average, 30% chance of above average.
Winter forecast – the building material
It’s that time of year again when we try to figure out what to expect for the upcoming winter. A seasonal forecast at any time of year is always tricky. But the winter forecast is the most difficult because you have far more factors to consider than just tropical forcing. When creating a seasonal forecast for the warm season (Spring and Summer), the primary forcing mechanisms are from the tropical regions so that one can focus on the state of ENSO. However, in the cold season months, one must consider various factors outside of the tropical regime like the Stratospheric Polar Vortex (which is absent in summer), the transport mechanisms between the tropospheric mid-latitudes and the stratospheric high latitudes, movement of stratospheric winds, and how all of these factors interact with each other.
Record warm year so far
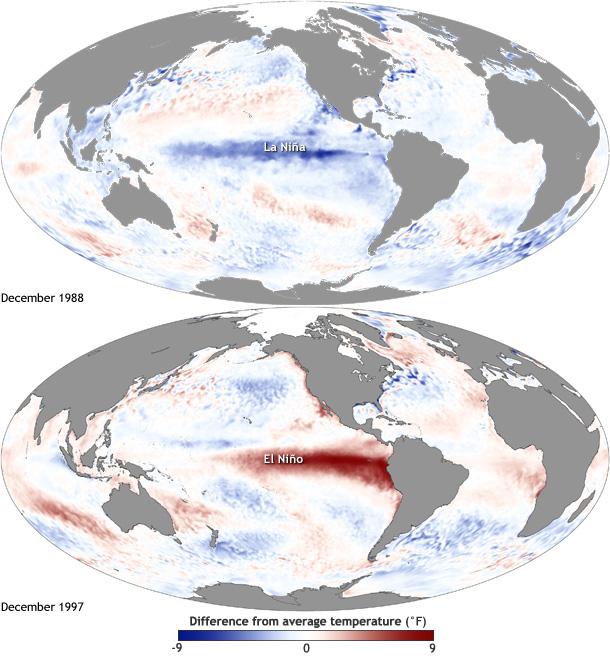
On top of the effects of climate change, there is extra warming of the global atmosphere from El Niño. This phenomenon means the ocean over the central and eastern tropical Pacific has warmed and that has major consequences for the weather all over the world. Years with an El Niño are warmer than usual worldwide. The combination of a warmer climate and El Niño has made 2023 a record warm year worldwide so far since measurements began.
It is even expected that we will approach 1.5C of warming this year. In such a warm year we logically also see that the amount of sea ice is lagging behind. Currently there is less sea ice than in 90% of the years in the current climate. However, a warm globe on average this winter does not necessarily mean that a cold winter can be ruled out for the UK.
The excess warmth globally is also expected to mute the ongoing moderate to strong El Nino event too. And because of this, composites pressure patterns of months in winters featuring El Nino and also positive Indian Ocean Dipole, which will be discussed, will perhaps be less reliable to base a forecast on.
The tools to build a winter forecast
The list of the tools we use to develop these trends are numerical models, indices and analogs. We develop our winter forecast based on these 3 main tools used together to best estimate pressure and temperature anomalies over Europe.
Why use all 3 parameters? Numerical models and analogs are regularly used for seasonal trends across all seasons. However, the drivers generally become important in mid-autumn until March. Indeed, they are effective when certain patterns begin to clearly emerge that seasonal models issued monthly may not have picked up on, so it is therefore easier to identify changes in indices which could have a knock-on effect for the rest of the winter.
Numerical models
There are a number of models that produce seasonal outlooks, European ECMWF, UK Met Office and American CFS are the main ones to look at and they update around the 10thof each month, so we will look at those to try and build a picture and also at the cross-model blend to see if there’s any consensus.
Drivers
The meteorological drivers which can influence weather patterns through the winter that will be discussed are the QBO (Quasi Biennial Oscillation), solar activity, ENSO (El Nino Southern Oscillation), Madden Julian Oscillation (MJO), North Atlantic Sea Surface Temperatures (SSTs), Northern Hemisphere snow extent and more. One of the most influential drivers is the El Nino Southern Oscillation (ENSO), the warming or cooling of the central and eastern tropical Pacific, which is one of the most important climate phenomena on Earth due to its ability to change the global atmospheric circulation, which in turn, influences temperature and precipitation across the globe.
Analogs
This tool helps to see if there could be a recurrence of anomalies in Europe for a defined period of time, in the case of the winter outlook – each of the three winter months. From archived data we can produce composites of analog winter months where indices such as ENSO phase and QBO phase were similar to what are forecast for the forthcoming winter.
Numerical Model seasonal forecasts
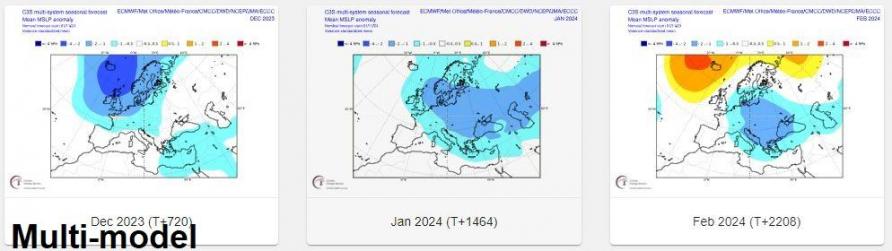
Multi-model MSLP for winter suggests an unsettled start to winter, especially Dec, low pressure close to east in Jan, strong northern blocking signal in Feb. A Classic El Nino winter.
Of the 3 main models we’ll focus on EC, CFS & UKMO in broad agreement with low pressure in charge close to north or west in December. But diverge in Jan/Feb.
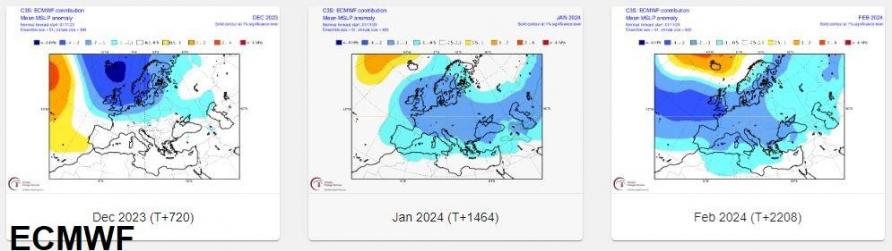
EC has a Greenland block signal January and February, but perhaps too far away to bring cold air to the UK, with troughing over UK likely to mean unsettled conditions likely more often than not, but possible winds veering northerly at times in January, bringing cold air. February perhaps greater chance of blocking pushing down from the north and the jet tracking further south at times to bring occasional colder weather.
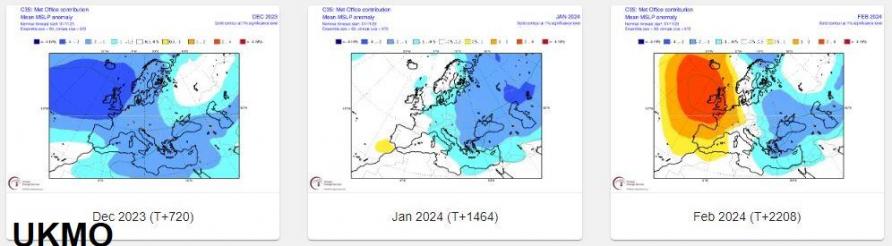
UKMO has a neutral or average height tendencies in January, so probably a bit of everything between mild spell and cold spell patterns that would make the month average. Then a strong blocking signal in February over NW Europe, suggesting a dry month with some cold spell potential.
CFS looks like a +NAO through all 3 winter months, so predominantly westerly regimes, but perhaps a greater chance of colder spells from the northwest or north in February – given more favourable orientation of the mean trough that month.
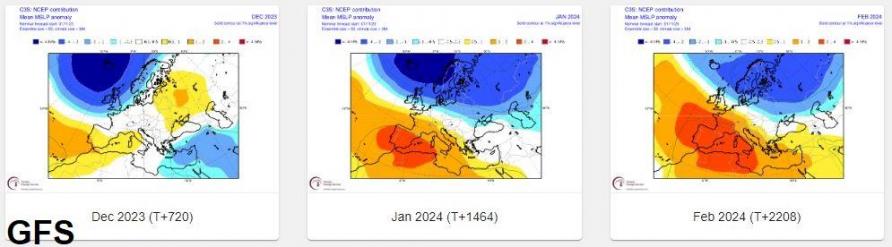
What we can conclude from the NWP seasonal forecasts with relative certainty is that winter 2023-24 will probably be different from the previous 3 or 4 winters.
Winter will probably feature more blocking later in winter than last winter - bringing drier periods later in winter, but also contain some more mobile wetter periods. However, temperatures are more difficult to gauge. The forecast anomalies appear positive in seasonal forecasts, despite the signal for high latitude blocking in January and especially February.
Temperature anomalies are positive over almost the entire surface of the globe, probably because of global warming and the current solar maximum. Although it is difficult to determine the precise cause of these anomalies, as any signal for colder weather is drowned out by global warming, leaving no negative anomaly to appear on the maps.
Of course, the models could be wrong. Moreover, the weather is sometimes difficult to predict in the long term, especially for our small islands. In addition, the maps only indicate the average, but even a mild month can have colder weeks.
Furthermore, winter always has an important trump card, namely sudden stratospheric warmings (also known as SSWs). This phenomenon occurs roughly twice every three years. It disrupts the polar vortex and increases the chance of a cold outbreak. An SSW cannot be predicted long in advance, which is why sometimes the model predictions can get it wrong.
The Drivers
ENSO (El Nino Southern Oscillation)
ENSO arises from changes in wind direction and sea surface temperatures in the tropical Pacific which in turn affects the climate of the tropics and sub tropics. When El Niño occurs, the central and eastern tropical Pacific Ocean becomes warmer than average. This leads to more thunderstorm activity here. The rising air in association with this enhanced convection in turn strengthens the Hadley Circulation – where air rises near the equator, spreads towards the poles, then sinks back to the surface in the subtropics. This changes the position and strength of the jet stream in the mid-latitudes which in turn affects weather patterns in North America and Europe.
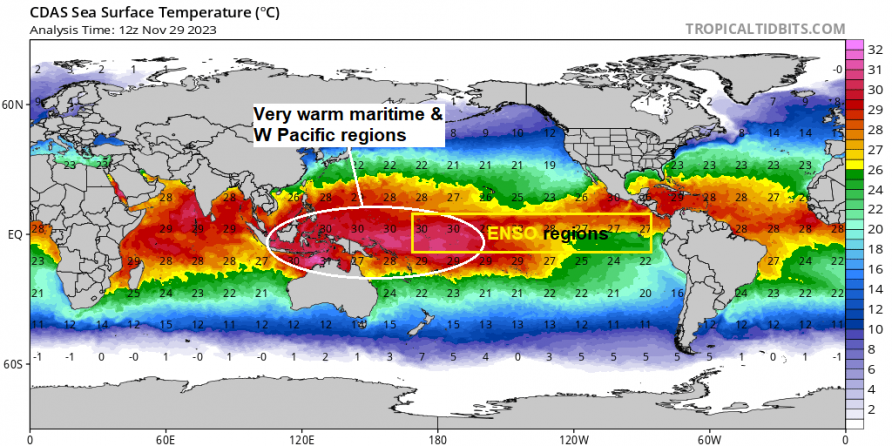
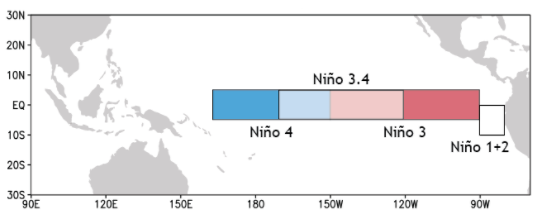
El Nino developed this summer following a triple-dip Nina that started in 2020 and now we have a moderate to strong basin-wide Nino, depending which index one uses, with near record anomalies in Nino 4 region in the west of the ENSO region, with a west Pacific Warm Pool. El Niño is associated with the weakening of easterly trade winds and the movement of warm water from the western Pacific toward the western coast of the Americas. The phenomenon can have widespread effects on global weather patterns, with its effects most pronounced in the northern hemisphere mid-to-high latitudes in winter.
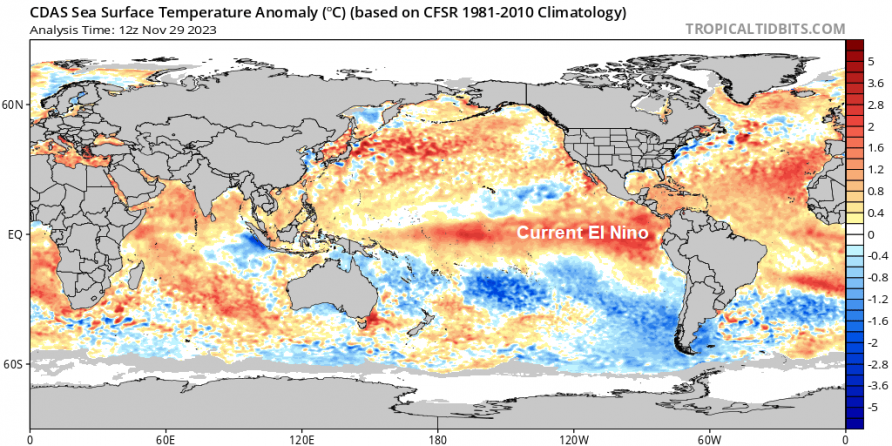
However, although the ONI index suggests a moderate El Nino as we head into winter, unlike other moderate El Nino events, the current event of anomalously warm central and eastern tropical Pacific is less distinguishable from the surrounding Pacific – which is anomalously warm this year, especially the Western Pacific, probably due to a warming climate.
This leads to a conundrum, because the greater the contrast in temperatures of Pacific waters surrounding the El Nino warm anomaly in the central and eastern Pacific – the greater the westerly winds that develop as a result of the greater thermal gradient. These temperature contrasts and imbalances are what drive winds globally, not just in the tropics, but when the contrast is weak the resultant winds area weaker. Over the tropical Pacific, westerly wind bursts (WWBs) develop over the western and central tropical Pacific tend to be more prominent when the western tropical pacific is markedly cooler than the central and eastern Pacific and these winds accentuate El Nino by pushing warmer SSTs towards the eastern Pacific. However, with the western tropical Pacific is warm at the moment too – around 30C+, with much less contrast to central and eastern Pacific than other El Nino events, the WWBs have been less prominent than other events.
Strong El Nino events, particularly ‘Super El Ninos’ tend to feature less high latitude blocking in winter, due to more unfavourable placement of the Hadley Cell. Weak to moderate events tend to feature more high latitude blocking, but this is a rather simplistic assumption – with exceptions. Differences in placement of the warmest El Nino SST anomalies in the central and eastern Pacific, as well as strength, can play a role in where greatest convective forcing on the atmosphere over the tropical Pacific and thus placements of the Hadley Cells and how this, in turn, affects the polar pressure patterns.
Strong El Nino events tend to be east-based over the tropical Pacific, due to stronger Westerly Wind Bursts (WWBs) pushing warmer waters towards the east, while weaker ones tend to be Modoki (west-based) with weaker WWBs. Basin-wide warm SST anomalies tend to be moderate events. This is the first time at the start of December that such a strong El Niño had an extensive +30C SST pool from the Maritime Continent (SE Asia to northern Australia) to east of the Dateline over the Pacific.
One of the main reasons for the warmest temperatures concentrated towards the west of the ENSO region, with SSTs of 30C+ over the western tropical Pacific, is due to a lack of many pronounced WWBs in the tropical Pacific.
The most recent update from the US Climate Predicition Center (27 Nov) is that El Niño is anticipated to continue through to the Northern Hemisphere spring (with a 62% chance during April-June 2024). However, El Nino forcing may not couple fully to the atmosphere until the New Year, when the rest of the Pacific cools to allow the El Nino warm SST anomalies to stand out from the surrounding warm SSTs, particularly the western Pacific, so other drivers may be the dominant forcing mechanism in early winter before El Nino has a large footprint in patterns.
Tropical stratosphere – QBO
The QBO manifests itself as downward-propagating easterly or westerly mean zonal winds in the equatorial stratosphere in a 22 to 28-month cycle. The driving force for the QBO is the vertical transfer of momentum from the troposphere to stratosphere by a broad spectrum of vertically propagating waves including Kelvin and Rossby waves.
Why is the QBO important to forecasting our winter weather? The QBO has proven itself an important part of winter weather development, as it can, among other things, impact the Polar Vortex and the jet stream, i.e.the power and direction of the polar jet stream can change with the QBO.
The QBO’s exact influence also depends on outside forcings, such as ENSO. The Oscillation alone doesn’t result in a fixed weather outcome: an east (negative) QBO will impact the Polar Vortex differently depending the ENSO state: El Niño or La Niña.
A recent NASA radiosonde analysis from Singapore (29 Nov) confirms the QBO in a descending ‘easterly’ phase. The descending/easterly QBO looks to settle down into 30MB and deeper - which is a good sign that it will stay solidly negative for the winter and not reverse.
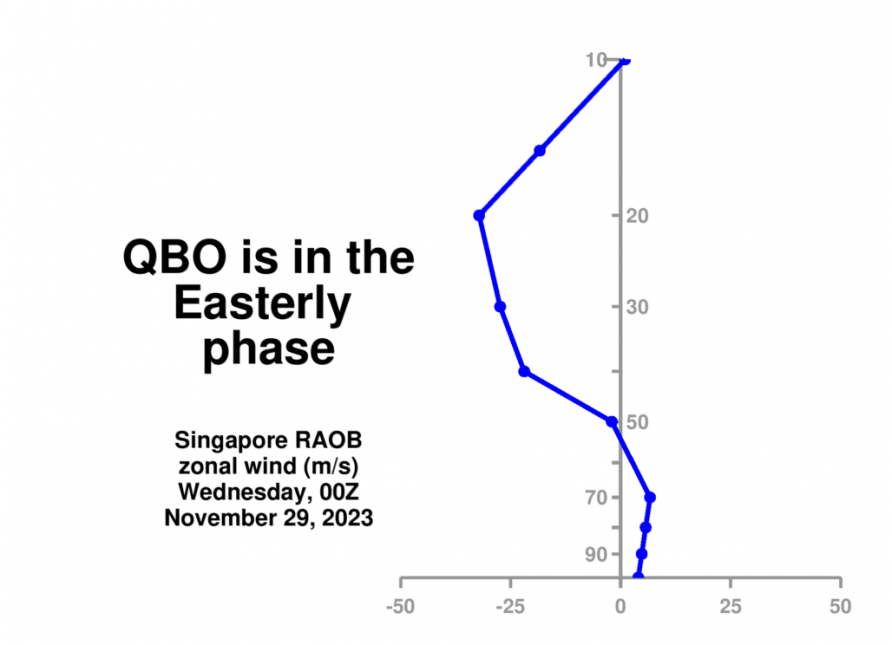
During an easterly QBO, there is an increased chance of a warming of the polar stratosphere (Sudden Stratospheric Warming), which in turn results in a weak Polar Vortex/stratospheric winter circulation and increases the chances of outbreaks of Arctic air to the lower latitudes over North America and Europe. The combination of El Niño and an easterly QBO increases the odds for a Sudden Stratospheric Warming and cold spells in mid-Latitudes.
Madden Julian Oscillation (MJO)
The MJO is a large-scale coupling between atmospheric circulation and tropical convection. It differs from ENSO in being a travelling pattern across the warm tropical oceanic areas of the globe rather than the standing pattern of El Nino / La Nina over the tropical Pacific. It is characterised by an eastward progression of large regions of either enhanced or supressed tropical rainfall, this anomalous rainfall area is mostly evident over the western Indian Ocean, then the warm tropical western and central Pacific as the MJO progresses eastward. The MJO wave of enhanced or supressed tropical rainfall is usually less evident when it moves over the eastern tropical Pacific and tropical Atlantic. The enhanced areas of rainfall or convection are followed by a dry phase when convection or thunderstorms are supressed – as the MJO wave propagates east. Each cycle of the MJO lasts about 30-60 days.
The strength and phase of the MJO can impact the location of the jet stream as well as the formation troughs and ridges. The MJO has far-reaching impacts on northern hemisphere extratropical weather through Rossby Wave propagation. The Rossby Wave propagation depends on the longitude of where the enhanced convection associated with the MJO wave takes place. As the MJO has a significant impact on northern hemisphere weather patterns, including the North America, Atlantic and Europe, there are correlations that can be made between the 8 different phases of the MJO and the lagged impacts on the upper air patterns that might be expected over the North Atlantic and Europe based on composites of previous events. The impact of the MJO on European weather is strongest about 10 days after the MJO is in phase 3 or 6, the probability of a strong +NAO is increased about 10 days after the MJO is in phase 3, but decreased 10 days after phase 6, with a probability of a -NAO increasing after MJO has passed through phases 7-8. However, the impact of the MJO on North Atlantic and European weather patterns depends on the strength of amplitude of the wave.
Areas of the tropics with the warmest SSTs are likely to be linked to more enhanced convection. I have already discussed the westward displacement of warmest SSTs over the tropical Pacific and that convective forcing is likely to remain concentrated over this area, despite warm El Nino SST anomalies that have developed over the central and Pacific. This is why more enhanced MJO activity has been prevalent in maritime and western Pacific phases throughout the autumn. And there is reason to believe that a similar forcing pattern of enhanced convection over the warmest +30C waters that are spread out from MJO 4 to MJO 7 phase regions near the Dateline, will also continue through much of winter too. This may increase the chance that winter will not feature a strong Polar Vortex in the mean, due to the prevalence of enhanced MJO activity over the maritime and western Pacific domains creating wave propagation to high latitudes weakening the polar vortex circulation. Though periods of strong Polar Vortex are possible early on in the winter.
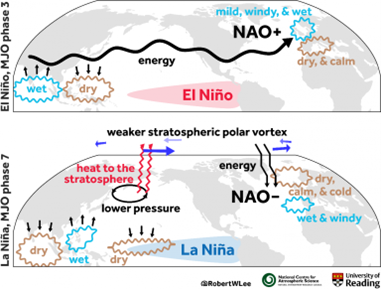
Source: Reading University Department of Meteorology
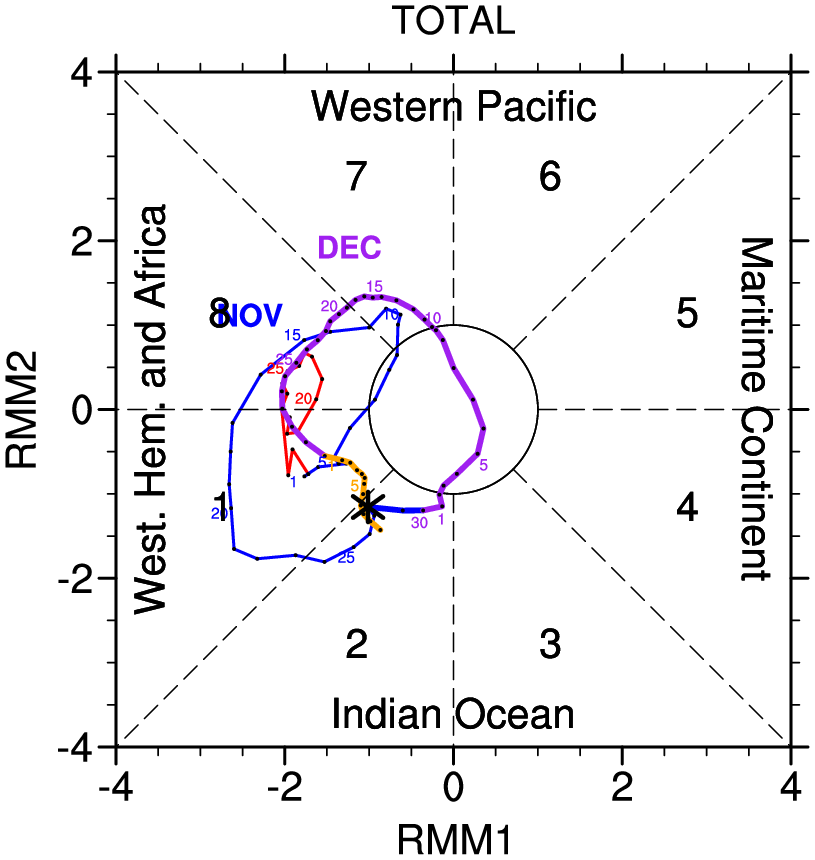
The MJO is currently over the Indian Ocean (phase 2 and 3). Most climate models suggest it will move across the Maritime Continent and into the western Pacific over the coming fortnight (phases 6-7-8-1). This increases chances of blocking over high latitudes of the North Atlantic and Europe – more particularly phase 7 and 8 in December. The last few days of November are featuring high latitude blocking over Svalbard and Greenland areas, this is likely a lag response to recent passage of MJO through phase 7-8-1 (Western Pacific). There is a lag of around 10 days following each phase of MJO and possible associated upper patterns forced by these phases manifesting.
An MJO RMM plot which combines the standard MJO with the current 120-day signal of the background base tropical forcing pattern suggests the MJO getting into P7 on Dec 15, P8 on Dec 20, P1 on Dec 25. So perhaps for the festive period of late December we may see a return of more high latitude blocking after a few weeks of Atlantic low-driven westerlies or southwesterlies.
We could see further MJO waves passing through western Pacific that could induce further periods of blocking for the rest of winter, but low confidence over when these may occur again, as the MJO can be erratic in speed of passage or strength. So, the MJO forecasts are only a useful guide up to about a month.
Atmospheric angular momentum (AAM)
Atmospheric angular momentum (AAM) is a complicated subject to discuss in layman’s terms, so I will try to make it simple. Basically, it is a measure of the rotation of the atmosphere around the Earth's axis, is a useful quantity to investigate changes in the global atmospheric circulation. Atmospheric angular momentum (AAM) can be a useful tool to predict sub-seasonal weather–climate phenomena and is a starting point for monitoring their regional impacts. It was discovered over 30 years ago that there are 50-day variations in length of day and global AAM. These variations were linked to the MJO which drives a coherent poleward and equatorward propagation of zonal mean zonal wind anomalies. Global AAM anomalies peak as the zonal mean zonal wind anomalies move into the subtropics. Global AAM is largest when MJO convection anomalies are weakening near the date line. Madden (1987, 1988) proposed that frictional torque anomalies over the Pacific Ocean basin to the east of convection anomalies were responsible for the exchange of angular momentum between the atmosphere and the earth. There tends to be an upward trend in AAM when MJO wave moves east and convection increases over the central Indian Ocean. As convection moves to the west Pacific, positive mountain torques from east Asian topography provide for a continued increase in AAM. AAM reaches a maximum as convection weakens near the dateline.
An increase in AAM as the MJO wave of tropical convection reaches the western Pacific (MJO phases 7-8-1) and the frictional and mountain torques they induce are responsible for transport of AAM anomalies from the tropics to the mid-latitudes which can lead to amplification of the upper flow in the mid-latitudes in winter by slowing the jet stream. A few models publish AAM forecast for a few weeks to a month ahead. However, getting hold of AAM predictions beyond a month has proved futile. But trends in AAM can be useful in predicting the possibility of blocking (+AAM spike) or zonal flow (-AAM).
ENSO and NAO relationship.
The North Atlantic Oscillation (NAO) index is based on the surface sea-level pressure difference between the Portugal or the Azores and Iceland. The positive phase of the NAO reflects below-normal heights and pressure across Iceland and the high latitudes of the North Atlantic and above-normal heights and pressure over the Azores and Portugal. The negative phase reflects an opposite pattern of height and pressure anomalies over these regions.
Generally, during El Niño early winter, the North Atlantic experiences a positive NAO-like pattern of atmospheric pressure due to the weakening of the tropical Walker circulation and the associated alteration in the meridional circulation over the North Atlantic. However, the North Atlantic is dominated by a negative NAO-like atmospheric response over the North Atlantic during El Niño late winter.
Atlantic SSTs
While El Niño causes anomalously high sea water temperatures in parts of the tropical Pacific Ocean, the North Atlantic Ocean also been rather warm this year, in fact record warm across the basin. The interaction with increasingly cold air from the north as we head into winter can favour an active jet stream and with it - quite a few chances of deep depressions, as we saw in early November and late October.
However, over the last few months, a ‘tripole’ SST pattern has developed over the North Atlantic, where there is an area of anomalously colder waters between the eastern seaboard of North America and the Bay of Biscay. Northern Europe experienced two severe winters in succession in 2009 and 2010 – which both featured a tripole pattern in North Atlantic sea surface temperature (SST) anomalies and exceptionally negative phases of the North Atlantic Oscillation (NAO).
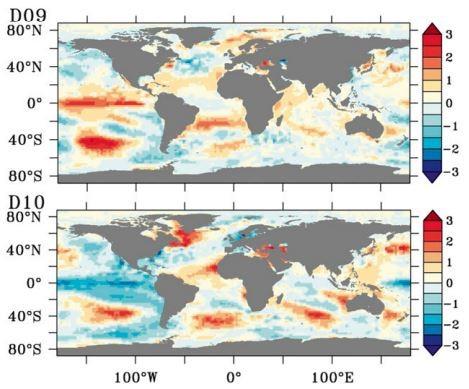
SST anomaly tripole evident in Dec 2009 and Dec 2010:
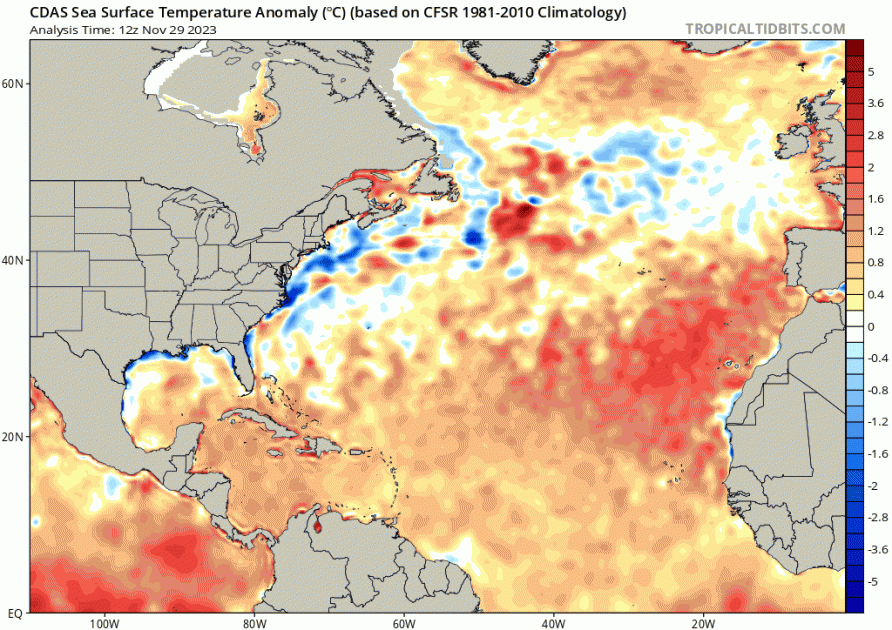
Current N Atlantic SST anomaly
Strong sea surface temperature (SST) tripole events exert active feedback on atmosphere through diabatic heat and transient eddy forcing. Positive SST anomalies in the Labrador Sea and seas around Greenland and negative SST anomalies further south towards the subtropical North Atlantic result in changes in the atmospheric pressure structure. The jet stream is deflected southward giving rise to a band of low pressure in the Azores around 40N and high pressure over Iceland – resulting in a -NAO pressure pattern.
So we may see an increased chance of periods of negative NAO with a southerly tracking jet stream, particularly in conjunction with periods following the MJO reaching favourable phases for high latitude blocking.
IOD
The Indian Ocean Dipole (IOD) is a prominent mode of air-sea interaction in the tropical Indian Ocean. During a positive IOD event, the sea surface temperature (SST) is anomalously cool in the southeastern Indian Ocean and anomalously warm in the western Indian Ocean, accompanied by pronounced anomalous easterlies over the central equatorial Indian Ocean and anomalous southeasterly along the coast of Sumatra. Negative IOD events are the opposite, with cool SSTs in the west and warmer-than-normal SSTs in the east.
The impacts of the IOD are not only felt in the tropics, but can also influence weather patterns across much of the mid-latitudes. The phase of the IOD contributes to determining important aspects of local and global climates.
The positive Indian Ocean Dipole (IOD) event continues and is currently tracking at strong levels. IOD events tend to break down as the northern hemisphere heads into winter, though the break down this year is likely to be slightly later than usual. All international climate models suggest the positive IOD is likely to ease in December.
The record strong +IOD in autumn 2019 and early winter of 2019-20 may well have enhanced the strength of the stratospheric polar vortex, powering a super-charged zonal jet stream which brought a very mild winter to Europe. However, there was no El Nino that year, ENSO was neutral through that winter. So although the +IOD may have some effect at ‘turbo’ charging the SPV early on this winter, El Nino and easterly QBO may weaken the strat PV through the winter.
Polar Vortex and Sudden Stratospheric Warmings
The polar vortex is mainly present in the winter months. This is a low-pressure area above the North Pole (or South Pole) that is located at some altitude. This height corresponds to the upper layers of the troposphere and the lower layers of the stratosphere.
A lot of cold is trapped in the polar vortex. The contrast between this cold air and the subtropical air from the south creates an active jet stream. The extent to which this jet stream is active is often the result of the polar vortex strength.
In summer there is a high pressure area above the North Pole, but during August and September the amount of sunshine at the North Pole decreases. This allows the atmosphere to start to cool. This means that there is more outgoing than incoming radiation. This cooling causes the creation of a low-pressure area at the pole - the polar vortex.
In winter - a weak polar vortex in the troposphere and/or stratosphere brings an increased chance of cold outbreaks to the lower latitudes, but what are the factors that ensure that a polar vortex can weaken? One of those factors that can weaken the stratospheric polar vortex is sudden stratospheric warming (SSW). This is a sudden warming in the stratosphere, including the formation of a high-pressure area. This causes the zonal winds to reverse higher up and blow from east to west instead of west to east.
However, there can be a decoupling between the stratosphere and troposphere polar circulations. So, there can be a weak tropospheric polar vortex but a fairly active stratospheric polar vortex. This can lead to blocked patterns in the troposphere with high pressure leading to cold outbreaks to the lower latitudes. Decoupling can also serve reduce the effects of a SSW on weather patterns. A major warming and reversal of zonal winds may be observed at the top of the stratosphere, but reversal does not penetrate down to the surface. That is one of the reasons why the winter of 2018-2019 was mild despite a SSW around the New Year in 2019.
There are also other weather phenomena that can affect the stratosphere. One of these is the ENSO. Research by Brönniman, S. (2007) states that in an El Niño winter the stratospheric polar vortex can be weaker. This also has an influence later in the season on the lower parts of the atmosphere with a negative NAO at the end of winters with an El Niño. However, in early winter, this signal tends to be reversed. So an El Nino can tend to favour a ‘back-loaded’ winter for cold.
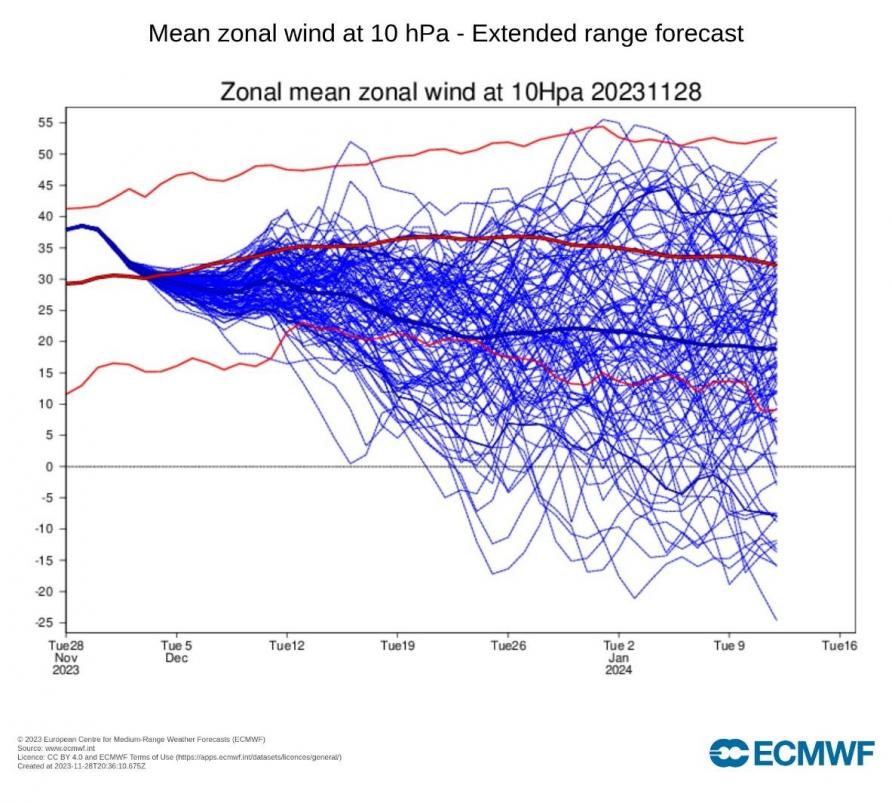
The strength of the polar vortex is difficult to forecast more than a month out, but the ECMWF does produce a zonal mean zonal wind chart for 10 hPa – which can give us an idea if a weakening looks plausible during December. The stratospheric polar vortex has been record strong recently, but forecasts do show it may weaken as we head through December, with some members even showing a reversal in zonal winds or a SSW.
Snow cover extent and Arctic Oscillation relationship
Studies have suggested that Siberian snow cover in autumn is a source of predictability of the Arctic Oscillation (AO) in winter. For example, when October snow cover is extensive over Eurasia it results in very cold temperatures in November across Siberia triggering strong upward wave activity, which in turn warms the stratosphere, leading to a -AO.
Although it is plausible that there is some dynamical mechanism that connects the two, the robustness of the theory has been put in doubt given that fall snow cover reconstruction derived from 20CR and the winter mean sea level pressure fields derived from 20CR or ERA-20C suggest that the snow-AO relationship is not robust across the twentieth century. Therefore, it is risky to predict the winter AO using a simple linear regression based on a Siberian snow cover index, especially as it relies on data measurements that only go back as far as the 1970s. Therefore, I think there is too much limitation of any empirical prediction of the AO only based on snow and/or sea ice predictors over Siberia.
However, snow cover is quite extensive over central, eastern and northeastern Europe to start winter, following low temperatures and heavy snowfall in late November. If this persists, then air sourced from the east will be pretty cold in early winter.
Solar Cycle
In general, taking account of the lag of the effects of reduced sunspot activity, years near and shortly following a solar minimum tend to have a weaker stratospheric polar vortex and are more prone to blocking, with the opposite true in solar maxima winters.
Studies have shown strong correlation between the electrical field strength of the solar wind and the temporal evolution of the NAO. The graph below suggests a relationship between the NAO index and the electric field strength E of the solar wind. A possible scenario for the suggested interaction is that an electromagnetic disturbance is generated by the solar wind in the global electric circuit of the ionosphere. This disturbance is then dynamically propagating downward through the atmosphere and subsequently influencing the large-scale pressure system in the North Atlantic region. A relationship is also evident on longer timescales when using the group sunspot number as a proxy for the solar wind.
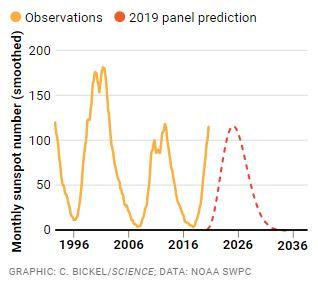
In 2019, as the sun approached a minimum in its 11-year cycle of magnetic activity. Currently the sun is ascending towards the peak of solar activity. Predictions are for Solar Cycle 25 to peak between January and October of 2024, with a maximum sunspot number between 137 and 173. The solar maximum may arrive within the next year, months ahead of previous forecasts. The original estimate was that solar maximum would occur sometime between December 2024 and March 2026.
However, although solar flares have been linked to triggering +NAO patterns and with peak of solar activity approaching making solar flares more likely, overall we think solar activity does not have a huge impact on winter patterns that more strongly driven by other drivers.
Statistics - The Analogs
While ENSO sea surface temperatures and QBO phases never repeat exactly from one year to another, it is still quite useful for long-range forecasting purposes to find “analog years” in which there are somewhat similar oceanic patterns to current conditions and also combining it with QBO phase – particularly as El Nino and an easterly QBO can increase the odds of disruption to the Polar Vortex. Therefore the following analog years (since 1960) have been used, though with the caveat that there are other factors such as global warming, +IOD, solar cycle, extra-tropical SSTs that aren’t taken into account that may cloudy the picture of the composites. While drivers that occur and change over a few weeks, such as MJO, can bring differences in weather patterns and thus temperature and rainfall within each winter month. But each month of the analog years can give us an idea of what the overall patterns could be seen.
|
DJF -QBO & Moderate El Nino |
|
2009-10 |
|
2002-03 |
|
1991-92 |
|
1986-1987 |
|
1972-1973 |
|
1968-1969 |
|
1965-1966 |
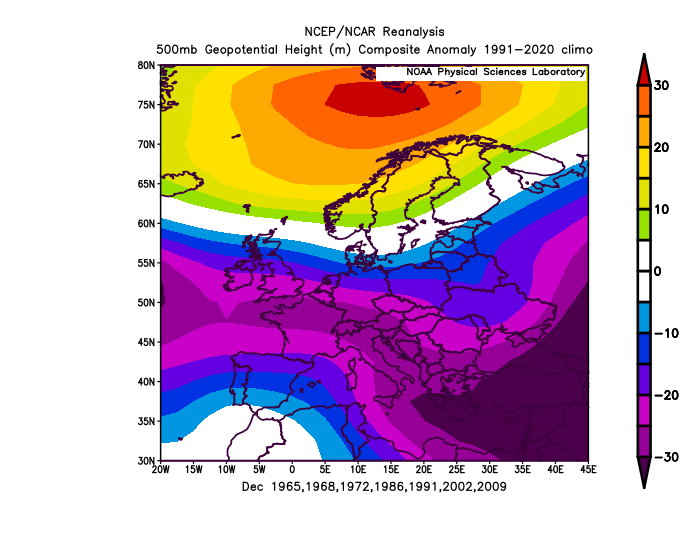
For December of the above winters featuring a -QBO during a moderate El Nino, the composite of H500 looks like this:
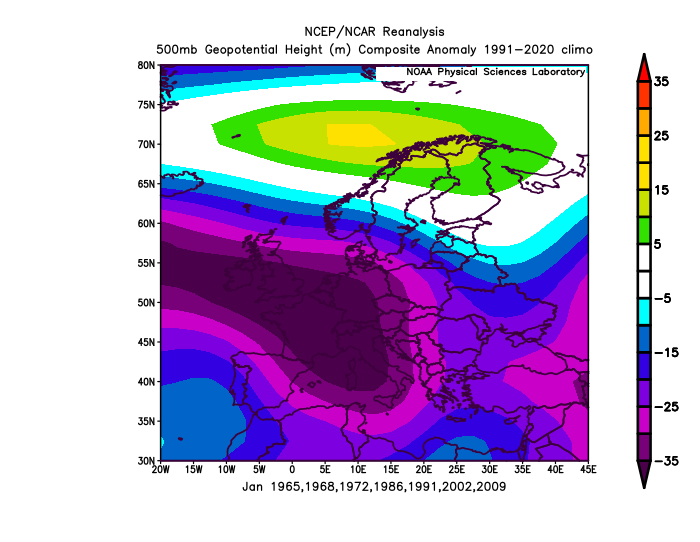
For January of the above winters featuring a -QBO during a moderate El Nino, the composite of H500 looks like this:
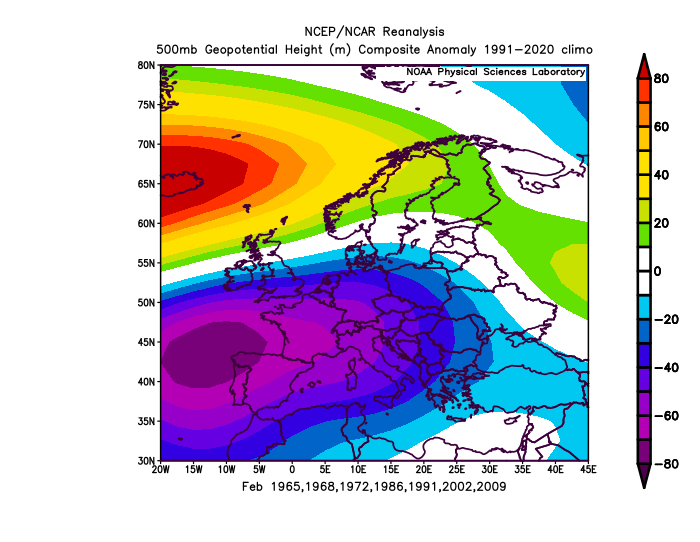
For February of the above winters featuring a -QBO during a moderate El Nino, the composite of H500 looks like this:
Putting all the signals from models, indices and analogs together to make a winter forecast
A lot of data to take in from the weather model seasonal forecasts, all the indices discussed and also the top analog years. But going through all the above discussed, a picture emerges of themes for each month.
December obviously the most likely to get accurate. Besides the indices that are unlikely to change month over the winter, such as ENSO, QBO, IOD, etc, we can use weather model seasonal forecasts which have a higher degree of skill for a month or so ahead than at longer range later in winter. And we can use indices such as MJO and AAM, along with stratospheric wind forecasts which only have usefulness of up to one month.
For December, transition of the MJO through phases 3-5 and a drop in AAM look to favour a return of more mobile/zonal Atlantic low-driven weather, with mild, wet and windy conditions at times. This driven by a strong polar vortex which maybe bolstered by the strong IOD However, mid-month there is a signal for the MJO to reach the western Pacific phases – which following a 10 day lag, can promote high latitude blocking over the far North Atlantic and northern Europe.
Through January it becomes increasingly difficult to have confidence, so we tend to rely more on weather model seasonal output and analog composites, as the MJO, although following cycles, can be too erratic or weak to calculate when it may reach certain phases for the rest of the winter. To complicate the picture, a SSW can occur, which can only be predicted well a few weeks in advance. Current ECWMF mean zonal wind at 10 hPa forecasts showing some members reversing late December and early January, with most members below the climate mean between Dec 16-26. This is commensurate with a -QBO and El Nino often leading to a weaker SPV. But we can also take into account other variables such as Atlantic SSTs – with the SST tripole perhaps forcing a -NAO pattern later in the winter, particularly February, even if there is no SSW in January. Furthermore, El Nino is likely to couple with the atmosphere in the New Year and Nino tends to favour colder patterns in Europe later in the winter too.
All that said, background global warming that has led to increased warming of the oceans, with excess heat after likely the warmest year on record being absorbed by the oceans, then feeding back to the atmosphere, may mean that air from mild sources during winter could be anomalously warm. So even though cold spells will occur, milder spells could be anomalously warmer than average – which may keep monthly temperatures above average – even if that month contains a cold spell, unless it is long one.
Long Range Forecast Updates
Stay upto date with the long range forecast throughout the year with the Month Ahead Forecast - Updated Every Monday.
More Weather Forecasts & News


Site Search